The MPG Number on That Window Sticker Was Never Meant to Match What You'd Actually Get
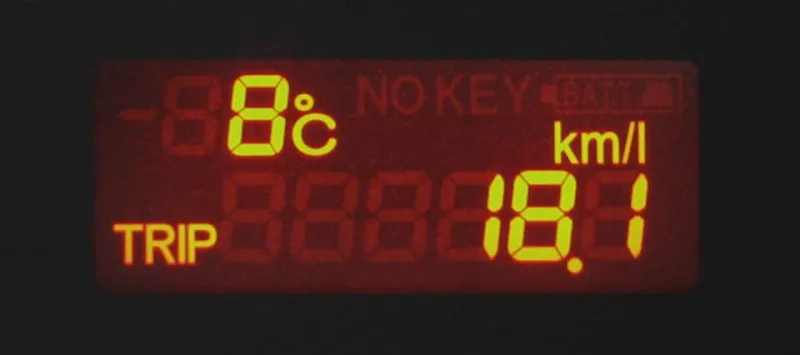
Photo: Qurren, CC BY-SA 3.0, via Wikimedia Commons
The Number That Doesn't Quite Add Up
You bought the car partly because of that number. Thirty-two miles per gallon on the highway — that's what the sticker said. That's what you calculated into your monthly fuel budget. That's what the salesperson smiled and confirmed when you asked.
Three months later, you're averaging closer to 27. You're not driving recklessly. You're not hauling a trailer. You're just driving.
The gap between EPA fuel economy ratings and real-world results is one of the most consistent frustrations in American car ownership. And the reason for it isn't that automakers are lying — it's that the test was never really designed to mirror how people drive in the first place.
How the EPA Actually Tests Fuel Economy
Fuel economy ratings in the United States are determined through standardized tests conducted by the EPA — or by automakers using EPA-approved methodology, which is its own interesting wrinkle. The testing doesn't happen on real roads. It happens on a dynamometer, which is essentially a stationary roller system that simulates driving conditions in a controlled environment.
There are multiple test cycles. The city cycle — formally called the Urban Dynamometer Driving Schedule — simulates stop-and-go driving at an average speed of just under 20 miles per hour, with a top speed of 56 mph. The highway cycle averages around 48 mph, with a top speed of 60 mph. There are also supplemental tests for high-speed driving, air conditioning use, and cold weather starting.
The problem isn't that these tests are fraudulent. It's that they're standardized — which means they're optimized for consistency and comparability across vehicles, not for accuracy against real American driving patterns.
What the Test Gets Wrong About Real Life
Start with speed. The highway test tops out at 60 mph. American highway speed limits are commonly 65, 70, or 75 mph — and traffic regularly moves faster than posted limits. Aerodynamic drag increases with the square of speed, which means driving at 75 mph requires significantly more fuel per mile than driving at 60. That gap alone can account for several MPG.
Then there's temperature. EPA testing happens at a controlled 68 to 86 degrees Fahrenheit. Cold winter mornings — common across most of the country from October through March — force engines to run richer fuel mixtures during warm-up, cutting efficiency noticeably. In northern states, real-world winter fuel economy can drop 15 to 25 percent below the rated figure.
Elevation and terrain don't factor into the dynamometer test either. A flat-road simulation doesn't account for driving in Denver, Asheville, or anywhere else where grades are a regular part of a commute.
And then there's driving behavior. The test cycles use pre-programmed acceleration and deceleration patterns that are, frankly, gentler than how most Americans actually drive. The city cycle's acceleration rate is modest. Real traffic involves harder stops, faster merges, and the kind of irregular rhythm that no lab simulation fully captures.
Why Automakers Designed It This Way — Sort Of
It's tempting to assume the EPA test exists to flatter automakers. The reality is more complicated.
The test was primarily designed to create a level playing field — a consistent methodology that lets consumers compare a Honda to a Toyota without the comparison being muddied by different testing conditions. That goal is legitimate and largely achieved. The ratings are reliable for comparison purposes even when they're imprecise in absolute terms.
Automakers do have an incentive to optimize for the test, though. Engineers can tune a vehicle's powertrain, transmission shift points, and fuel mapping to perform particularly well within the specific parameters of EPA test cycles. A car that earns a 35 MPG highway rating may have been tuned in ways that favor 60 mph steady-state cruising over the 72 mph highway driving that most of their customers actually do.
This isn't illegal, and it isn't exactly hidden. But it does mean the number on the sticker reflects a version of your car behaving under conditions that don't quite match your driveway, your commute, or your road trips.
The EPA Knows, and Has Said So
The EPA itself acknowledges the gap. Its own website states that actual mileage will vary based on driving conditions, driving habits, vehicle condition, and other factors. The agency introduced updated test cycles in 2008 specifically to close some of the gap between lab and road — and those revisions did help. Before 2008, the disconnect was even wider.
Third-party data from sources like the Department of Energy's fueleconomy.gov platform, which aggregates real-world MPG reports from actual drivers, consistently shows averages that run 10 to 20 percent below EPA estimates for most vehicles.
The Takeaway
The fuel economy figure on a window sticker is a useful tool for comparison shopping — just not a reliable budget forecast. It was built to measure consistently, not to predict accurately. When you're planning what a car will actually cost you to drive, shave 10 to 15 percent off the EPA estimate and you'll land somewhere closer to reality. The sticker isn't wrong exactly — it's just answering a slightly different question than the one you were asking.